

Background: Multiple myeloma (MM) remains an incurable plasma cell (PC) malignancy. Despite improvements in clinical outcomes, variability in treatment response exists. Some patients experience innate resistance, while others develop resistance over the course of treatment. Identifying signatures of treatment response and resistance is essential to predicting effective treatment strategies. Given the phenotypic clonal heterogeneity observed in MM, we hypothesize that resistant and sensitive subpopulations have unique phenotypic signatures. We used mass cytometry (CyTOF) to characterize primary MM samples and correlated their phenotypic signatures with treatment response.
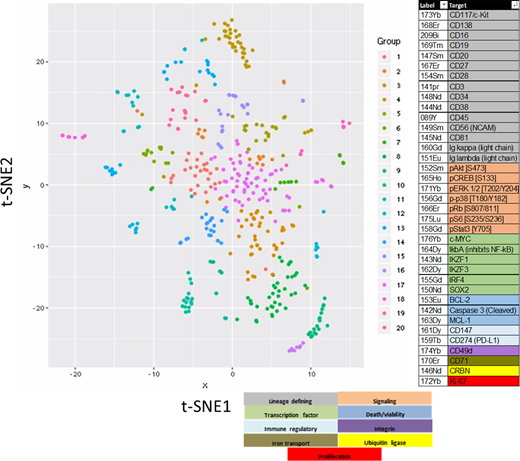
Methods: We characterized 102 primary MM samples by CyTOF using 37 antibodies (see figure). Frozen whole BM specimens were thawed, stained with antibodies, barcoded, and analyzed on a Helios mass cytometer. Data was processed using Cytobank or Pathsetter and analyzed using t-distributed stochastic neighbor embedding (t-SNE) algorithm. T-SNE plots for CD45+ cells were created using lineage defining markers. T-SNE plots of neoplastic PCs (CD138+,CD3-,CD16-,CD19-,cytoplasmic kappa or lambda+) were created using all remaining markers. A differential analysis of each sample's clusters was performed against all other events. Z-score values, representing marker changes from the differential analysis, for each cluster were used to group similar clusters across all samples, allowing us to compare sub populations of PCs between patients (see figure). From these groups of clusters with similar changes in markers, we calculated the proportion of cells with increases or decreases in markers for each sample. Results were compared to IMWG 90-day response criteria using a random forest model.
Results: We performed mass cytometry on 102 samples from 68 unique MM patients. Median age was 66 years (range 34-95) with a 1.5:1 male:female ratio. 37 (36%) had NDMM, 55 (54%) had RRMM, 2 (2%) had SMM and 8 cases (8%) had unknown status. FISH studies revealed 47 (46%) had hyperdiploidy without a recurrent primary IgH rearrangement, 31 (30%) had t(11;14), 13 (13%) had t(4;14), 5 (5%) had 14;16 or 14;20, 3 (3%) had hyperhaploidy and 3 (3%) had an undefined primary. 54 (53%) had 1q gain/amp, 22 (22%) had TP53 deletion, 22 (22%) had a MYC rearrangement and 71% had high mSMART risk. Nearly all patients received an immunomodulatory compound, a proteasome inhibitor and dexamethasone. 2 (2%) had complete response (CR), 10 (9.8%) very good partial response (VGPR), 36 (35%) had partial response (PR), 14 (14%) had minimal response (MR), 13 (13%) had stable disease (SD) and 17 (17%) had progressive disease (PD).
Characterization of CD45+ cells identified a relatively conserved and reproducible map from each patient. Notable differences included an ~2-fold reduction in the percentage of total B cells (CD45+,CD3-,CD19+)/total CD45+ cells in cases with high risk mSMART, RRMM and TP53 deletion compared to cases with standard risk, NDMM or normal TP53 status. Similar B-cell reductions were found in RRMM vs. NDMM samples from matched-patients. In contrast to the conserved t-SNE structure of the CD45+ population, the neoplastic PC population displayed dramatically reduced t-SNE structural consistency. Heterogeneity between patient samples and between the same patient samples over time was observed. We focused our analysis on 22 patients with serial samples. The proportion of each t-SNE group present in each patient sample was calculated and then correlated to the 90-day response metric. We identified a phenotypic group whose proportion increased in relation to disease progression (R2=0.85). This group had elevated BCL-2, pSTAT3, CD56 levels and reduced CD45 and CD81 levels. Evaluating individual markers, we found an increase in the proportion of cells with elevated BCL-2, pS6, Ki67, and IKZF1 levels in relation to disease progression. We also observed an increase in the proportion of cells with reduced pCREB levels and a reduction in the proportion of cells with reduced CD147 levels in relation to disease progression.
Conclusions: We have utilized CyTOF to characterize phenotypic and functional markers in MM cells on a single cell level and can identify unique subgroups that change in relation to disease progression. Future analysis will correlate phenotypic signatures with ISS stage, mSMART risk, cytogenetic abnormality and type of treatment.
Kumar:Kite Pharma: Consultancy, Research Funding; Oncopeptides: Consultancy, Other: Independent Review Committee; IRC member; Celgene/BMS: Other: Research funding for clinical trials to the institution, Consulting/Advisory Board participation with no personal payments; Takeda: Other: Research funding for clinical trials to the institution, Consulting/Advisory Board participation with no personal payments; Sanofi: Research Funding; MedImmune: Research Funding; Karyopharm: Consultancy; Merck: Consultancy, Research Funding; Carsgen: Other, Research Funding; Cellectar: Other; Novartis: Research Funding; Adaptive Biotechnologies: Consultancy; AbbVie: Other: Research funding for clinical trials to the institution, Consulting/Advisory Board participation with no personal payments; Genecentrix: Consultancy; Genentech/Roche: Other: Research funding for clinical trials to the institution, Consulting/Advisory Board participation with no personal payments; Janssen Oncology: Other: Research funding for clinical trials to the institution, Consulting/Advisory Board participation with no personal payments; Amgen: Consultancy, Other: Research funding for clinical trials to the institution, Consulting/Advisory Board participation with no personal payments, Research Funding; Tenebio: Other, Research Funding; BMS: Consultancy, Research Funding; Dr. Reddy's Laboratories: Honoraria.

This feature is available to Subscribers Only
Sign In or Create an Account Close Modal